Graphs of Functions
After studying this section, you will be able to:
- recognise and use the form of the equation for a straight line (linear function)
- draw and recall the graphs of simple non-linear functions
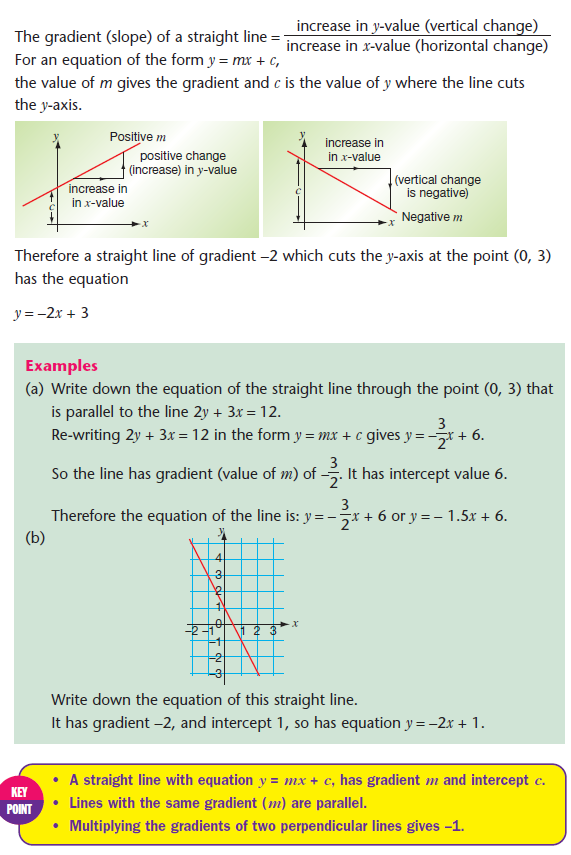
Equations of straight lines
Image
Graphs of non-linear functions
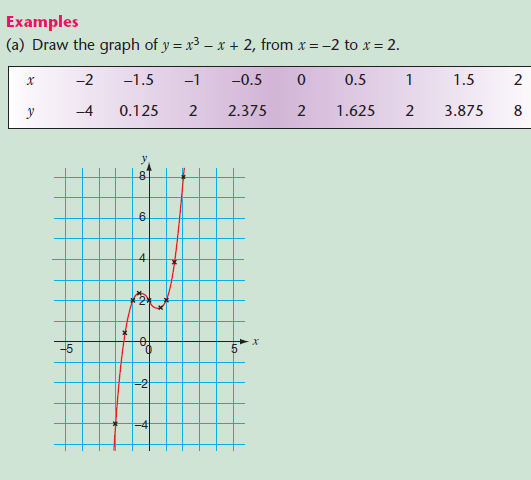
Sometimes you will be able to see a pattern in the results table. If it breaks down for a point, you may have made a mistake.
First, fill a table of values by substituting into the equation − you may well be asked to fill in a partially complete one.
Then draw as smooth a curve as possible through the points − if the smoothness is interrupted by a point, you have probably made a mistake − check your substitution. All the graphs you will be asked to draw will be smooth curves − don’t join the points by a series of short straight lines; you will not get any marks.
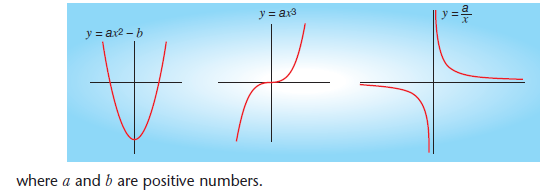
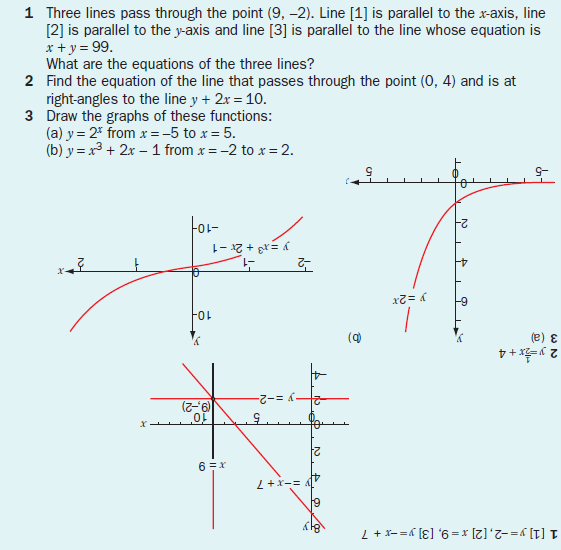
You need to be able to recognise and draw graphs like these:
Image
NOTE:
In the exam you will probably be given a 2 mm grid, possibly with the axes labelled.
Always check the values of the units on the x and y-axis scales.
Image
Image
PROGRESS TEST
Image
Category
