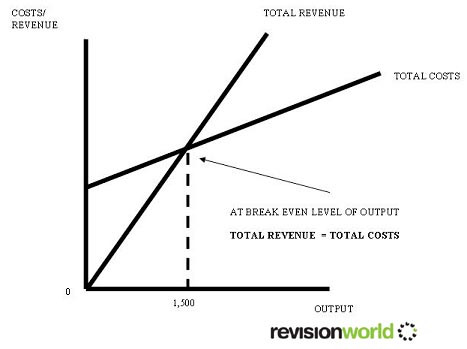
Break even is the point of production where are firms revenue is equal to the total costs of production
Margin of safety – the difference between the firms current level of output and break even output
Break even = Fixed costs / contribution per unit
Break even analysis can help managers to plan and in their operations. In addition it can help:
- Analyse the impact of a change in the environment on the business
- Decide whether or not to accept an order for products at a different price from normal
Break even analysis can use a number of methods:
- Contribution method
- Break even chart
- Break even graph
Break-even diagram
Image

Uses of break-even analysis
- Allows to decide if a business venture is financially viable
- Looks at what will happen if level of production changes
- To support an application for an external source of finance e.g. loan or mortgage application
Changes in the business environment and break even
- If Variable Costs (VC) rise in value then break even output increases
- If VC fall in value break even output decreases
- If Fixed Costs (FC) rise break even output increases
- If FC fall break even output falls
- If selling price increases break even output decreases
- If selling price decreases break even output increases
