Maxwell-Boltzmann Distribution
Below is a Maxwell-Boltzman distribution curve.
It shows the distribution of molecular energies in a gas.
As the temperature increases the peak of the line moves lower and to the right.
(From the blue to the red on the picture.)
The area under the graph represents the total number of particles and stays the same whatever the temperature.
Image
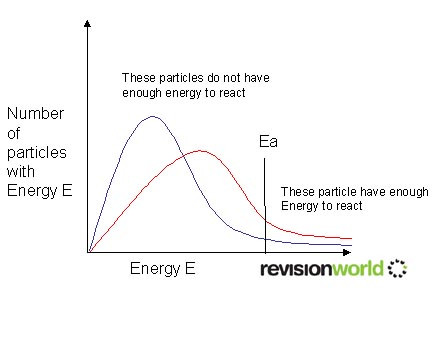
Ea is the activation energy. Only collisions occurring with more than this energy result in reaction.
Increasing the temperature increases the number of collisions occurring above the activation energy.
The change from blue to red is only an increase in temperature of 10°C, however the number of particles that have enough energy to react has increased significantly
Category
