The demand curve shows the relationship between price and quantity demanded.
Generally the higher the price of a product the smaller the quantity demanded. As price decreases quantity demanded increases. Therefore the demand curve has a negative slope
The Demand Curve
Image
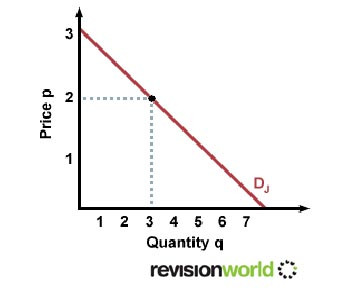
The demand curve shows an inverse relationship between price and quantity demanded
If price changes then you would move along the demand curve to calculate any change in quantity demanded
Shifts in the Demand Curve
Changes in the following factors causes a shift in the demand curve:
- Prices of other goods – either substitutes or compliments
- Incomes
- Tastes and fashions
- Consumer expectations
- Advertising
- Population level and structure
These factors can enable the demand curve to shift to the:
- Left (less demanded at each price)
- Right (more demanded at each price)
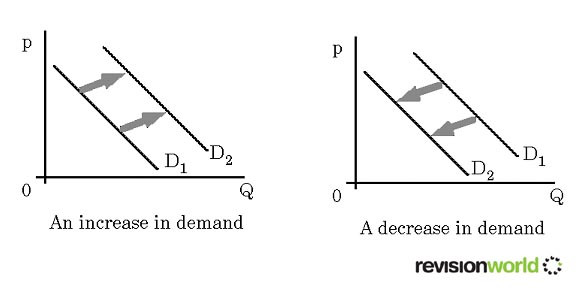
These graphs show what would happen if
- Demand increased
- Demand decreased
Image