Demand and Supply Analysis in Specific Markets
Demand and supply may work differently in different markets
Governments may pay subsidies to producers in certain markets
These reduce producers costs of production and encourage them to produce more therefore the firms supply curve shifts to the right
Subsidies are often common in agricultural markets, where industries are struggling e.g. shipbuilding and where goods are perceived as merit goods
Consumer Surplus
- A consumer surplus arises is where consumers are willing to pay more for a good / service than they actually do
- As the government provides health care free on the NHS this represents a consumer surplus
Different Markets
- In commodity markets such as coffee and oil demand and supply interact to create an equilibrium price
- In the housing market prices have risen as demand has outstripped supply causing a shift in the demand curve
The Supply Curve
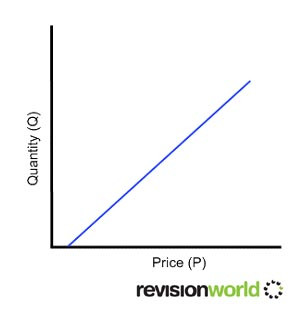
The supply curve shows the relationship between price and quantity demanded
- The supply curve generally slopes upwards at higher prices more is supplied
- There is a positive relationship between price and quantity supplied
- As price increases revenues would increase for the supplier
- If revenues increase then profits would be likely to increase encouraging producers to increase production levels
- If price changes the quantity demanded will change – this will indicate a movement along the supply curve

Shifts in the Supply Curve
The following factors influence supply:
- Profitability of other goods in production
- Technology
- Costs of production
- Natural shocks
- Social factors
Expectations of producers
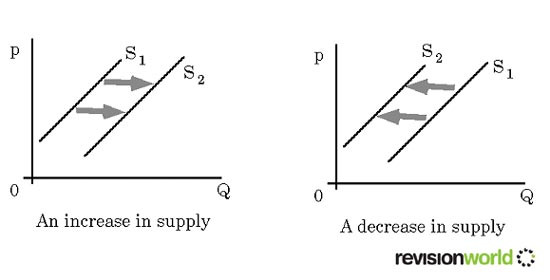
Changes to any of these factors will cause the supply curve to shift:
- Supply curve shifts to the left – less will be supplied at every price
- Supply curve shifts to the right – more will be supplied at every price
Shifts in the Supply Curve
These graphs show the consequences of:
- An increase in supply
- A decrease in supply

