Interaction of AD and AS
Aggregate Demand and Aggregate Supply diagrams can show:
- Causes of inflation
- Demand deficit unemployment
- Economic growth
In the short run where the AD and AS curves interact is the level of national income
Image
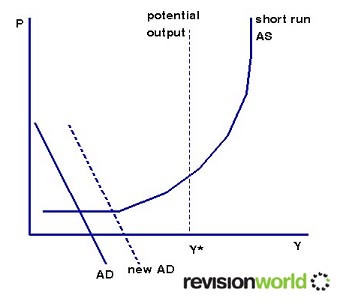
If the price level changes this is represented by movements along the AD / AS curves
Category