The Atmosphere on the move
Movement in the atmosphere is probably the most obvious of its characteristics, the study of the forces that control movement being fundamental to our understanding of how energy (in the form of heat) is distributed around the globe by the global circulation.
The horizontal air movement described is called advection; vertical movements are called convection. Air motion is initiated by a pressure gradient (air density variations) between places, with movement occurring between high- and lowpressure locations.
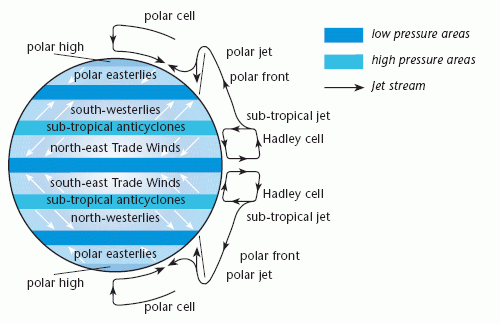
The existence of large-scale convection models was recognised by George Hadley (in 1735) and William Ferrel (in 1889). Their postulations contributed to the equator-to-pole Convection Cell model (see diagram below).
Air does circulate in a conventional fashion, but there are consequences for the atmosphere related to this movement. They involve the rate at which the air can rise or fall (the equation of state), the ability of air to expand or contract (the thermodynamic equation) and the fact that air will continually circulate (the equation of continuity). And because we view movement from a moving platform, an apparent deflection of moving objects due to the Earth’s rotation occurs, the socalled
Coriolis Effect. In the mid-latitudes the pressure gradient and Coriolis are in balance. This leads to air blowing not from high to low pressure areas, but between the two, parallel to the isobars, a geostrophic wind.
Global air movements
These occur at a variety of scales. There is a close relationship between major winds and the world’s pressure systems. Windbelts also contain the world’s major weather systems; hurricanes in the tropics, cyclones and depressions in the mid latitudes (and at a smaller scale – tornadoes).

Mid-latitude movements
Found between the polar and tropical circulations is an area of complex upper air movements. The combination of the powerful Ferrel westerlies (the so-called circumpolar vortex) and the jet streams, in the mid-latitudes, affect surface weather/winds and pressure systems. These surface winds and weather belts are bound up in a series of waves known as Rossby Waves. The link between the
Rossby waves, jet streams and weather systems in the low- and high-pressure
circulation is called the index cycle.
Jet streams are fast (200m/hr) and found at about 12 000 m. They appear where warm and cold air mix. They guide weather systems (W to E) in the Northern Hemisphere. Shifts in their location can affect our weather for long periods.
Rossby waves form because of the Earth’s thermal differences, the rotation of the Earth, and because of the destabilising effect of mountain ranges.
Influence of the oceans on atmospheric movement
- They provide water for the hydrological cycle.
- They absorb and redistribute energy, e.g. the Gulf Stream and North Atlantic Drift benefit Western Europe by releasing heat to warm, and provide a milder climate than might otherwise be the case.
- Warmed oceans and their currents can therefore affect local and distant locations.
El Nin~o (Southern Oscillation – ENSO) ‘The Christ Child’
El Nin~o is the unusual warming of the surface ocean layers in the Tropical Pacific areas, peaking around Christmas; it has a profound effect on world weather patterns. Occurring every few years, its cause is unclear, speculation suggests that volcanic eruptions and their release of pollutants may be a cause. Once thought to have an effect that was purely local, it’s now thought the effects are felt globally. Chronologically over the last 30 years El Nin~o has been linked to the following:
1972 – warm water ingress, into normally cold water, along the South American coast, killed off plankton and the fishing industry.
- 1977 – drought in California. Severe cold on the Eastern seaboard of the USA.
- 1982 to 83 – catastrophic global weather. Drought in Africa and Australasia, torrential rainfall in Bolivia, Peru and Ecuador, intense winter storms on the US Pacific coast and hurricanes in Hawaii and Tahiti. At this time, locally the sea temperature rose by just 3°C! 1500 people died and there was $8 billion in property damage.
- 1991 to 95 – precipitation anomalies. California receives a year’s rain in January 1995, cost to the USA $2 billion. Floods inundate Germany, Belgium, Holland and France. Drought affects Australia, India and South Africa.
- 1999 – Venezuela, Mexican and Peruvian flood disasters.
El Nin~o has also been linked to the spread of disease resulting from the abnormally warmed water. Cholera killed 5000 in Peru in 1991; malaria has spread to cover 45% of the world; Dengue fever, carried by mosquitoes, has since 1988 killed 4000 in the America’s, mostly in Mexico; Bubonic plague increases are also linked to ElNin~o.
La Nin~a, is the opposite of El Nin ~ o. It refers to a period of cold surface water in the Pacific. The two temperatures oscillate back and forth. La Nin ~ a’s effect is potentially as devastating as El Nin~o.
