Critical path analysis
After studying this section you should be able to:
- construct an activity network from a given precedence table including the use of dummies where necessary
- use forward and backward scans to determine earliest and latest event times
- find the critical path in an activity network
- calculate the total float of an activity
- construct a chart for the purpose of scheduling
The process of representing a complex project by a network and using it to identify the most efficient way to manage its completion is called critical path analysis.
Activity networks
A complex project may be divided into a number of smaller parts called activities.
The completion of one or more activities is called an event.
Activities often rely on the completion of others before they can be started. The relationship between these activities can be represented in a precedence table, sometimes called a dependency table.
In the precedence table shown on the right, the figures in brackets represent the duration of each activity, i.e. the time required, in hours, for its completion.

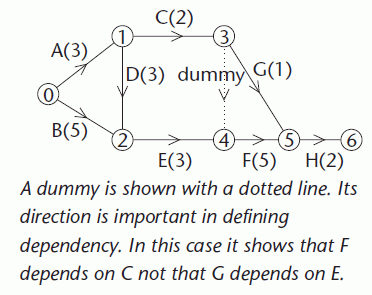
A precedence table can be used to produce an activity network. In the network, activities are represented by arcs and events are represented by vertices.
The vertices are numbered from 0 at the start vertex and finishing at the terminal vertex.
The direction of the arrows shows the order in which the activities must be completed.
There must only be one activity between each pair of events in the network. The notation (i,j) is used to represent the activity between events i and j.
A dummy activity is one that has zero duration. A dummy is needed in this network to show that G depends on C whereas F depends on C and E.

Earliest event times
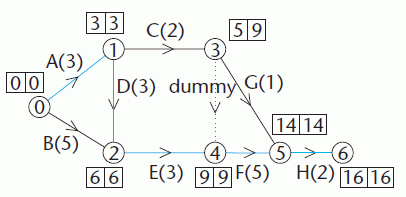
The earliest event time for vertex i is denoted by ei and represents the earliest time of arrival at event i with all dependent activities completed. These times are calculated using a forward scan from the start vertex to the terminal vertex.
Latest event times
The latest event time for vertex i is denoted by li and represents the latest time that event i may be left without extending the time for the project. These times are calculated using a backward scan from the terminal vertex back to the start vertex.
The critical path is the longest path through the network. The activities on this path are the critical activities. If any critical activity is delayed then this will increase the time needed to complete the project. The events on the critical path are the critical events and for each of these ei = li.

It is useful to add the information about earliest and latest times to the network.
The critical path is then easily identified. Notice that B(5) lies between two critical events but it is not a critical activity.
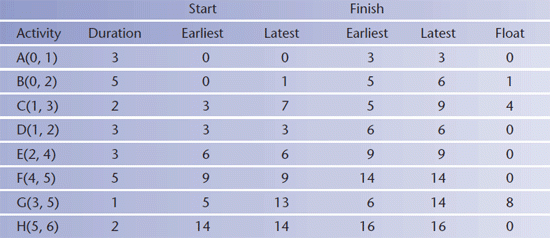
The total float of an activity is the maximum time that the activity may be delayed without affecting the length of the critical path. It is given by:
latest finish time - earliest start time - duration of the activity.
The total float of any critical activity is always zero.
Scheduling
The process of allocating activities to workers for completion, within all of the constraints of the project, is known as scheduling.
The information regarding earliest and latest times for each activity is crucial when constructing a schedule. This information may be presented as a table or as a chart.

Typically, the purpose of scheduling is to determine the number of workers needed to complete the project in a given time, or to determine the minimum time required for a given number of workers to complete the project.
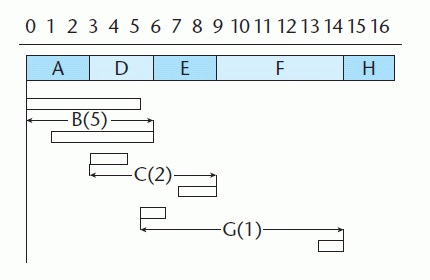
The critical activities are shown along one line.
The diagram illustrates the degree of flexibility in starting activities B, C and G. Remember that G cannot be started until C has been completed.

The diagram shown is known as a cascade chart or Gantt chart.
PROGRESS CHECK

