Linear Regression
Scatter Diagrams
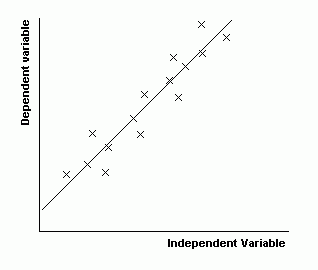
We often wish to look at the relationship between two things (e.g. between a person"s height and weight) by comparing data for each of these things. A good way of doing this is by drawing a scatter diagram.
"Regression" is the process of finding the function satisfied by the points on the scatter diagram. Of course, the points might not fit the function exactly but the aim is to get as close as possible. "Linear" means that the function we are looking for is a straight line (so our function f will be of the form f(x) = mx + c for constants m and c).
Here is a scatter diagram with a regression line drawn in:

Correlation
Correlation is a term used to describe how strong the relationship between the two variables appears to be.
We say that there is a positive linear correlation if y increases as x increases and we say there is a negative linear correlation if y decreases as x increases. There is no correlation if x and y do not appear to be related.
Explanatory and Response Variables
In many experiments, one of the variables is fixed or controlled and the point of the experiment is to determine how the other variable varies with the first. The fixed/controlled variable is known as the explanatory or independent variable and the other variable is known as the response or dependent variable.
We shall use "x" for the explanatory variable and "y" for the response variable, but we could have used any letters.
Regression Lines
By Eye
If there is very little scatter (we say there is a strong correlation between the variables), a regression line can be drawn "by eye". You should make sure that your line passes through the mean point (the point (x,y) where x is mean of the data collected for the explanatory variable and y is the mean of the data collected for the response variable).
Two Regression Lines
When there is a reasonable amount of scatter, we can draw two different regression lines depending upon which variable we consider to be the most accurate. The first is a line of regression of y on x, which can be used to estimate y given x. The other is a line of regression of x on y, used to estimate x given y.
If there is a perfect correlation between the data (in other words, if all the points lie on a straight line), then the two regression lines will be the same.
Least Squares Regression Lines
This is a method of finding a regression line without estimating where the line should go by eye.
If the equation of the regression line is y = ax + b, we need to find what a and b are. We find these by solving the "normal equations".
Normal Equations
The "normal equations" for the line of regression of y on x are:
Sy = aSx + nb and
Sxy = aSx2 + bSx
The values of a and b are found by solving these equations simultaneously.
For the line of regression of x on y, the "normal equations" are the same but with x and y swapped.
