Costs
Costs of Production
Businesses calculate the cost of production
- For forecasting and budgeting
- To set prices so they make a profit
- To work out if they can make a profit
Costs
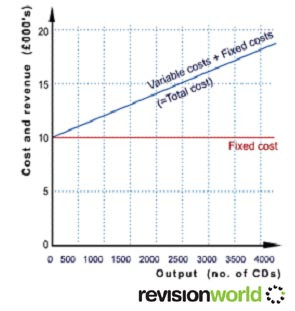
Fixed costs
- These do not alter with output
- Examples – rent, management salaries, rates
- Graphically fixed costs will always be illustrated by a horizontal line
- As output changes fixed costs stay the same
Variable costs
- Alter directly with the business’s level of output
- Examples – fuel, raw materials
- Graphically variable costs will always be a diagonal line from the origin
- As output changes variable alter directly
Total costs
- These are fixed and variable costs added together
Semi variable
- These have a fixed and a variable element
Image
Direct Costs
- Attributed to the production of a particular product and vary directly with output e.g direct materials and labour
Indirect Costs
- Can't be allocated to the production of a specific product and relate to the business as a whole e.g. indirect labour costs, administration
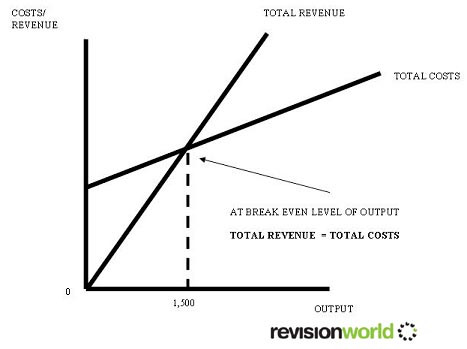
Break-even Analysis
A business breaks even if it does not make a profit or a loss. It is the point at which the business makes just enough revenue to cover their costs. In other words profit = zero.
Businesses must make a profit to survive. To make a profit, revenue must be higher than costs.
Break even analysis can use a number of methods:
- Contribution method
- Break even chart
- Break even graph
Image
Calculating the break-even point (contribution method)
Breakeven Point = Fixed Costs / (Selling Price - Fixed Costs per Unit)
This involves a two part calculation:
Selling Price per unit – variable cost per unit = contribution (towards fixed costs).
AND
Fixed costs divided by contribution = Break even point.
Category
