Cartographic skills
This section explains cartographic skills needed to read different types of maps. Understanding atlas maps is essential for interpreting both physical and human landscapes. Whether reading OS maps for navigation, GIS maps for data analysis, or geological maps for land study, geographical skills are vital for exploring and understanding the world.
Understanding Atlases
Atlases provide a range of maps at both global and national scales. Some atlas maps focus on physical features, depicting natural landforms and environmental characteristics, while others highlight human features, representing elements created by people.
Physical Maps
Physical maps illustrate natural landscapes, including:
- Mountains and lowlands – e.g., the Himalayas, the Scottish Highlands.
- Rivers and lakes – e.g., the River Thames, Lake Victoria.
- Seas and oceans – e.g., the Atlantic Ocean, the Mediterranean Sea.
Ecosystems – e.g., deserts like the Sahara, tropical rainforests like the Amazon (see below).
Image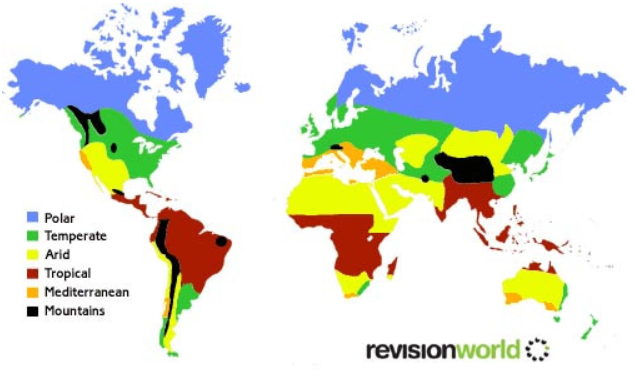
Relief and Drainage
On a national scale, physical maps provide more detailed relief features (showing land height and slope) and drainage patterns (rivers and lakes).
Climate Maps
Some maps show physical features that are experienced rather than seen, such as:
- Average temperature – maps indicating climate zones.
- Rainfall distribution – showing areas of high or low precipitation.
Human and Political Maps
Political Maps
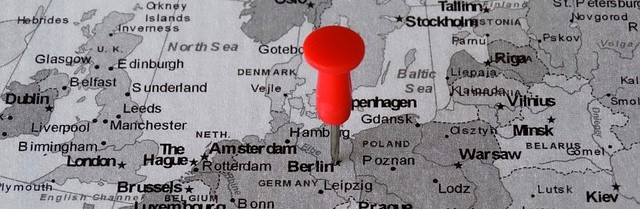
These maps show country boundaries, capital cities, and major urban areas. Examples include maps outlining the United Kingdom and its constituent nations or global maps highlighting national borders.
Image
Human Maps
Human maps display features shaped by human activity, such as:
- Population distribution – showing where people live.
- Migration patterns – illustrating movements of people between regions.
- Transport routes – including roads, railways, and shipping lanes.
- Settlement layouts – detailing cities, towns, and villages.
Experiential Human Maps
Some maps represent human features that are not visible, including:
- Life expectancy maps – showing average longevity across different countries.
- Standard of living maps – indicating wealth and quality of life.
- World happiness index maps – depicting countries based on happiness levels.
These maps often use colour coding, with shades ranging from red (low values) to yellow (high values) to represent different levels.
Understanding Map Directions
Compass Directions
Image
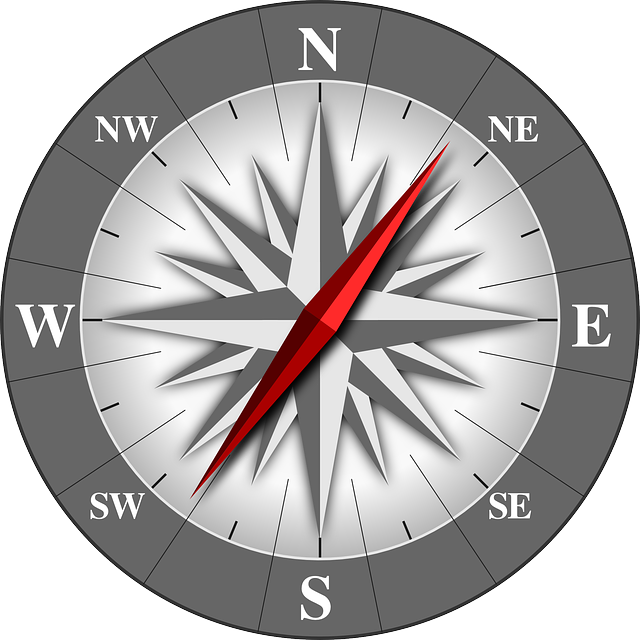
Maps typically include a direction arrow to indicate north. The main compass points are:
- North (N) – at the top.
- East (E) – to the right.
- South (S) – at the bottom.
- West (W) – to the left.
Intermediate points include:
- North-East (NE), South-East (SE), South-West (SW), North-West (NW).
- Further subdivisions, e.g., East-North-East (ENE), provide even greater precision.
Latitude and Longitude
Latitude and longitude enable precise location identification on maps.
Latitude
- Lines run horizontally (east-west).
- The Equator (0° latitude) divides the Earth into the Northern and Southern Hemispheres.
- Locations are measured in degrees north (N) or south (S).
Longitude
- Lines run vertically (north-south).
- The Prime Meridian (0° longitude) runs through Greenwich, London.
- Locations are measured in degrees east (E) or west (W).
Example: Manchester, UK is located at 53.5°N, 2.2°W.
Ordnance Survey (OS) Maps
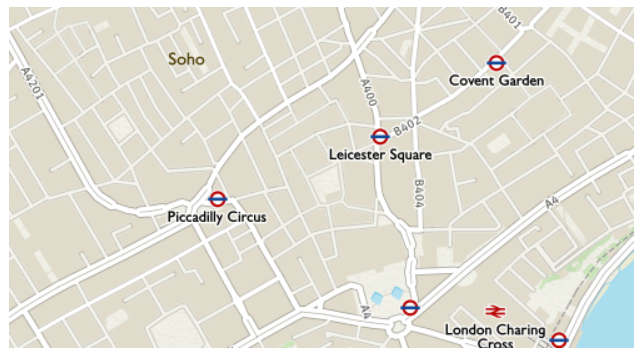
The Ordnance Survey (OS) produces detailed paper and digital maps of Great Britain, widely used for navigation and geography studies.
Image
Using a Key
OS maps use symbols to represent features, making maps easier to read. Common symbols include:
- Cross – place of worship.
- Red triangle – youth hostel.
- Lighthouse symbol – lighthouse location.
Scale and Distance
Scale indicates the relationship between distances on a map and real-world distances:
- Large-scale maps (1:1,250, 1:2,500, 1:10,000) show more detail, often used for towns and cities.
- Small-scale maps (1:25,000, 1:50,000, 1:100,000) cover larger areas, used for regions and countries.
Grid References
Grid references provide precise locations on an OS map using blue grid lines:
- Eastings – numbers along the bottom, increasing eastward.
- Northings – numbers along the side, increasing northward.
Four-Figure Grid References
Used to locate a square on a map:
- Find the easting number (bottom-left of the square).
- Find the northing number (bottom-left of the square).
- Combine them (e.g., 13 42).
Six-Figure Grid References
Used for a specific point within a square:
- Write the two-digit easting, then estimate tenths (e.g., 134).
- Write the two-digit northing, then estimate tenths (e.g., 426).
- Full reference: 134 426.
Height Representation on Maps
Spot Heights
A specific point’s height above sea level, shown in metres.
Contour Lines
Contour lines join areas of equal height:
- Close lines indicate steep slopes.
- Wide-spaced lines indicate gentle slopes.
These can be used to create cross-section diagrams of landscapes.
Other Types of Maps
Sketch Maps
Simple drawings highlighting features of a landscape, often used in fieldwork. They can be annotated to indicate physical and human impacts.
Photographs
- Ground-level – taken from eye level.
- Aerial – captured from aeroplanes, showing wider areas.
- Satellite images – taken from space, covering vast regions.
Geographical Information Systems (GIS)
Digital maps with data layers that can be manipulated to show:
- Shaded areas – to display trends.
- Graphs and charts – to visualise statistics.
- Photographs – attached to specific locations.
- Flow lines – illustrating movements (e.g., migration, trade).
Geology Maps
Produced by the British Geological Survey (BGS), these maps show underlying rock formations.
Understanding Geology
- Rock types influence land shape, soil type, and drainage.
- Chalk landscapes have alkaline soils, ideal for crops like asparagus.
- Mudstone formed over 200 million years ago when the UK was a desert.
Geological Features
- Faults – cracks in rocks (solid black lines).
- Thrusts – areas where rocks are forced upwards (dashed lines).
- Coastal resistance – e.g., chalk cliffs in Swanage and the Isle of Wight.
Category
