Data Flow Diagrams & Systems Flowcharts
Once the systems analysts have completed their investigation they produce a detailed description of how the existing system works.
Methods used to help describe the system include data flow diagrams and systems flowcharts
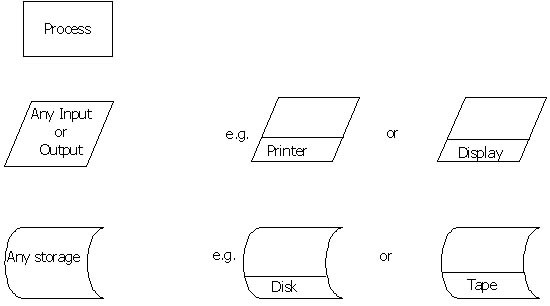
Symbols used in DFDs
Image

External entity (symbol1 - top)– data source or data destination, for example people who generate data such as a customer order, or receive information such as an invoice.
Process (symbol2) – an operation performed on the data. The two lines are optional; the top section of the box can be used to label the process, the middle to give a brief explanation, the bottom to say where the process takes place.
Data store (symbol3) – such as a file held on disk or a batch of documents
Data flow (symbol4 - bottom) – the arrow represents movement between entities, processes or data stores. The arrow should be labelled to describe what data is involved.
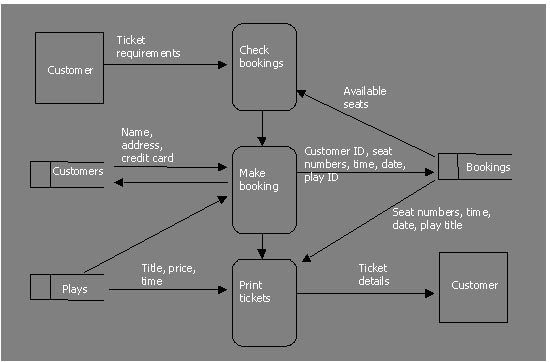
Data flow diagram for a theatre booking system.
Image
The symbols used in flowcharts
Image
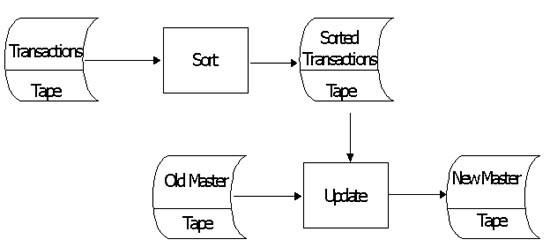
A systems flowchart
Image
Category
