Histograms
Histograms are similar to bar charts apart from the consideration of areas. In a bar chart, all of the bars are the same width and the only thing that matters is the height of the bar. In a histogram, the area is the important thing.
Example
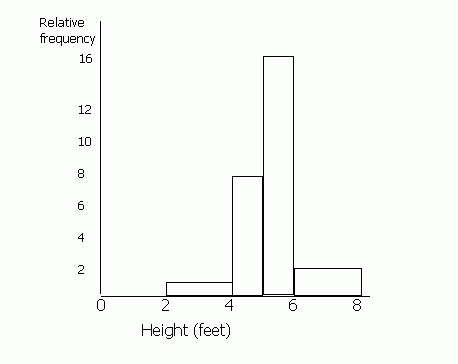
Draw a histogram for the following information.
| Height (feet): | Frequency | Relative Frequency |
| 0-2 | 0 | 0 |
| 2-4 | 1 | 1 |
| 4-5 | 4 | 8 |
| 5-6 | 8 | 16 |
| 6-8 | 2 | 2 |
(Ignore relative frequency for now). It is difficult to draw a bar chart for this information, because the class divisions for the height are not the same. The height is grouped 0-2, 2-4 etc, but not all of the groups are the same size. For example the 4-5 group is smaller than the 0-2 group.
When drawing a histogram, the y-axis is labelled 'relative frequency' or 'frequency density'. You must work out the relative frequency before you can draw a histogram. To do this, first you must choose a standard width of the groups. Some of the heights are grouped into 2s (0-2, 2-4, 6-8) and some into 1s (4-5, 5-6). Most are 2s, so we shall call the standard width 2. To make the areas match, we must double the values for frequency which have a class division of 1 (since 1 is half of 2). Therefore the figures in the 4-5 and the 5-6 columns must be doubled. If any of the class divisions were 4 (for example if there was a 8-12 group), these figures would be halved. This is because the area of this 'bar' will be twice the standard width of 2 unless we half the frequency.
If you are having problems working out the height of each of the bars, you can use the formula
Area of bar = frequency x standard width

