Travel Graphs
Speed, Distance and Time
The following is a basic but important formula which applies when speed is constant (in other words the speed doesn't change):
Remember, when using any formula, the units must all be consistent. For example speed could be measured in m/s, distance in metres and time in seconds.
If speed does change, the average (mean) speed can be calculated:
Average speed = total distance travelled
total time taken
Units
In calculations, units must be consistent, so if the units in the question are not all the same (e.g. m/s, m and s or km/h, km and h), change the units before starting, as above.
The following is an example of how to change the units:
Example
Change 15km/h into m/s.
15km/h = 15/60 km/min (1)
= 15/3600 km/s = 1/240 km/s (2)
= 1000/240 m/s = 4.167 m/s (3)
In line (1), we divide by 60 because there are 60 minutes in an hour. Often people have problems working out whether they need to divide or multiply by a certain number to change the units. If you think about it, in 1 minute, the object is going to travel less distance than in an hour. So we divide by 60, not multiply to get a smaller number.
Example
If a car travels at a speed of 10m/s for 3 minutes, how far will it travel?
Firstly, change the 3 minutes into 180 seconds, so that the units are consistent. Now rearrange the first equation to get distance = speed × time.
Therefore distance travelled = 10 × 180 = 1800m = 1.8km
Velocity and Acceleration
Velocity is the speed of a particle and its direction of motion (therefore velocity is a vector quantity, whereas speed is a scalar quantity).
When the velocity (speed) of a moving object is increasing we say that the object is accelerating. If the velocity decreases it is said to be decelerating. Acceleration is therefore the rate of change of velocity (change in velocity / time) and is measured in m/s².
Example
A car starts from rest and within 10 seconds is travelling at 10m/s. What is its acceleration?
| Acceleration | = | change in velocity | = | 10 | = | 1m/s² |
|
time |
10 |
Distance-Time Graphs
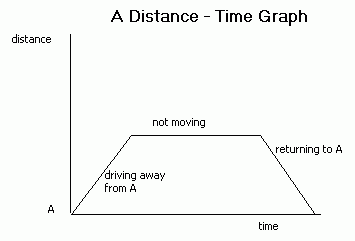
These have the distance from a certain point on the vertical axis and the time on the horizontal axis. The velocity can be calculated by finding the gradient of the graph. If the graph is curved, this can be done by drawing a chord and finding its gradient (this will give average velocity) or by finding the gradient of a tangent to the graph (this will give the velocity at the instant where the tangent is drawn).

Velocity-Time Graphs/ Speed-Time Graphs
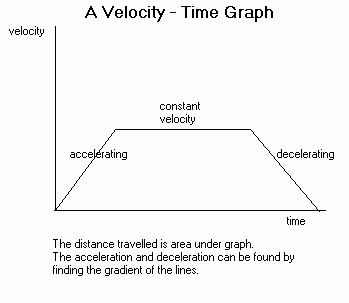
A velocity-time graph has the velocity or speed of an object on the vertical axis and time on the horizontal axis. The distance travelled can be calculated by finding the area under a velocity-time graph. If the graph is curved, there are a number of ways of estimating the area (see trapezium rule below). Acceleration is the gradient of a velocity-time graph and on curves can be calculated using chords or tangents, as above.

The distance travelled is the area under the graph.
The acceleration and deceleration can be found by finding the gradient of the lines.
On travel graphs, time always goes on the horizontal axis (because it is the independent variable).
Trapezium Rule
This is a useful method of estimating the area under a graph. You often need to find the area under a velocity-time graph since this is the distance travelled.

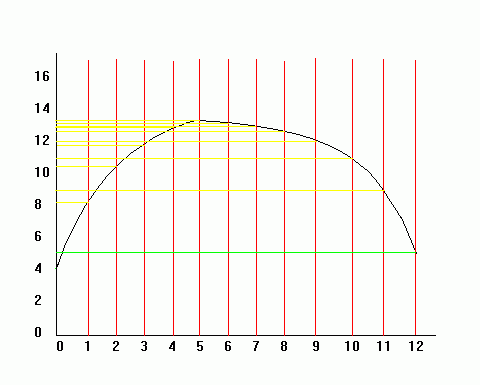
Area under a curved graph = ½ × d × (first + last + 2(sum of rest))
d is the distance between the values from where you will take your readings. In the above example, d = 1. Every 1 unit on the horizontal axis, we draw a line to the graph and across to the y axis.
'first' refers to the first value on the vertical axis, which is about 4 here.
'last' refers to the last value, which is about 5 (green line).]
'sum of rest' refers to the sum of the values on the vertical axis where the yellow lines meet it.
Therefore area is roughly: ½ × 1 × (4 + 5 + 2(8 + 8.8 + 10.1 + 10.8 + 11.9 + 12 + 12.7 + 12.9 + 13 + 13.2 + 13.4))
= ½ × (9 + 2(126.8))
= ½ × 262.6
= 131.3 units²
