Markets
This section explains markets covering, the interaction of supply and demand and the drawing and Interpretation of supply and demand diagrams to show the causes and consequences of price changes.
The Interaction of Supply and Demand
In a market economy, price is determined by the interaction of supply (what producers are willing to sell) and demand (what consumers are willing to buy).
- Demand: The quantity of a good or service that consumers are willing and able to buy at different prices.
- Supply: The quantity that producers are willing and able to sell at different prices.
When plotted on a graph:
- The demand curve slopes downwards from left to right (as price falls, quantity demanded increases).
- The supply curve slopes upwards from left to right (as price rises, quantity supplied increases).
The point where the two curves intersect is the equilibrium:
- Equilibrium price: The price at which supply equals demand.
- Equilibrium quantity: The amount bought and sold at the equilibrium price.
The Drawing and Interpretation of Supply and Demand Diagrams to Show the Causes and Consequences of Price Changes
Shifts in Supply or Demand affect the market equilibrium, leading to price changes.
Demand shifts (caused by factors other than price):
- Increase in demand → demand curve shifts right → higher equilibrium price and quantity.
- Decrease in demand → demand curve shifts left → lower equilibrium price and quantity.
Causes:
- Changes in consumer income
- Trends and tastes
- Advertising
- Prices of substitutes or complements
- Demographic changes
Supply shifts (caused by factors other than price):
- Increase in supply → supply curve shifts right → lower equilibrium price and higher quantity.
- Decrease in supply → supply curve shifts left → higher equilibrium price and lower quantity.
Causes:
- Changes in production costs
- Technological advances
- Indirect taxes or subsidies
- Weather conditions (for agricultural goods)
- Changes in the number of suppliers
Image
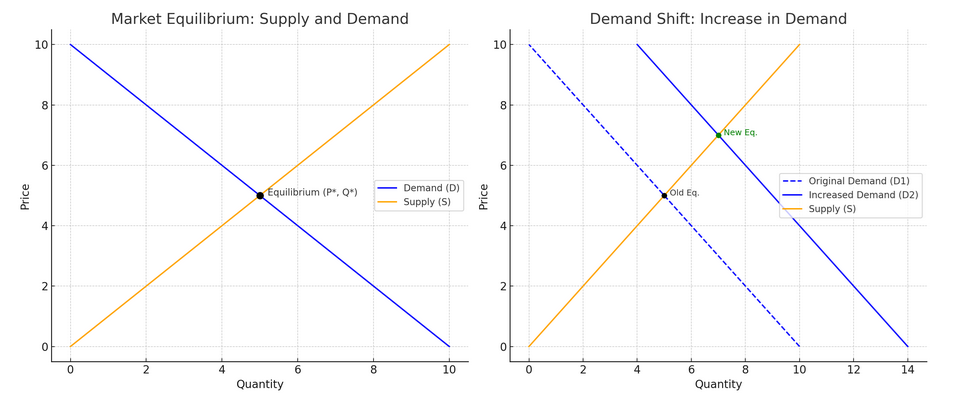
Left Diagram: Basic Supply and Demand Interaction
- Shows how the market equilibrium is formed where the demand and supply curves intersect.
- At this point, the equilibrium price (P*) and quantity (Q*) are set.
Right Diagram: Increase in Demand
- The demand curve shifts right (from D1 to D2), representing a rise in demand (e.g. due to higher income or popularity).
- As a result, both price and quantity increase.
- The market moves to a new equilibrium (higher price and output).
Category
