Demand
This section explains Demand as part of A-Level Economics covering, The Distinction Between Movements Along a Demand Curve and Shifts of a Demand Curve, The Factors That May Cause a Shift in the Demand Curve (The Conditions of Demand) and The Concept of Diminishing Marginal Utility and How This Influences the Shape of the Demand Curve.
The Distinction Between Movements Along a Demand Curve and Shifts of a Demand Curve
Understanding demand involves distinguishing between two key concepts:
Movements Along a Demand Curve
Definition: A movement along the demand curve occurs when there is a change in the price of the good or service, leading to a change in the quantity demanded.
Image
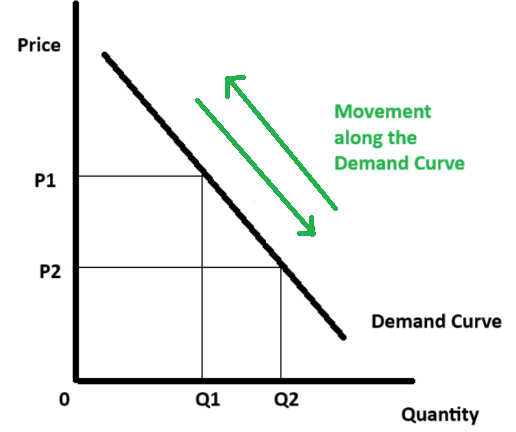
Reason for Movement: A change in price leads to a change in the quantity demanded, but not a shift in the demand curve itself.
- Example: If the price of coffee decreases, the quantity demanded increases, leading to a movement down the demand curve (downward movement).
- Key Point: Movements along the demand curve are caused by changes in the price of the good or service.
Shifts of the Demand Curve
Definition: A shift in the demand curve occurs when there is a change in any factor other than the price that affects demand. This leads to a change in demand at all price levels.
Image
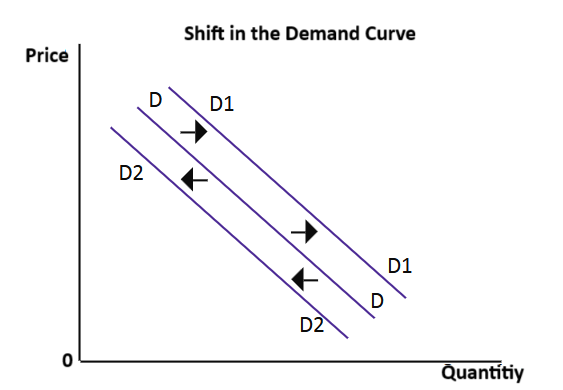
Reason for Shift: The demand curve shifts due to changes in non-price factors that influence consumer behaviour, such as income, tastes, and expectations.
- Example: If consumers' incomes increase, the demand for normal goods (such as cars or electronics) will increase, shifting the demand curve to the right.
- Key Point: Shifts in the demand curve are caused by changes in factors other than price (e.g., income, preferences, etc.).
The Factors That May Cause a Shift in the Demand Curve (The Conditions of Demand)
The demand curve can shift due to several factors, known as the conditions of demand. These are the non-price factors that influence consumer purchasing behaviour.
Key Factors Causing a Shift in Demand:
Income:
- Increase in income: For normal goods, as income rises, demand increases, shifting the demand curve to the right. For inferior goods, as income rises, demand decreases, shifting the demand curve to the left.
- Example: An increase in consumer income may lead to greater demand for luxury cars (normal good), but a decrease in demand for second-hand clothing (inferior good).
Tastes and Preferences:
- If consumers' tastes change in favour of a good, demand for that good will increase, shifting the demand curve to the right.
- Example: If there is a health trend promoting plant-based diets, the demand for vegan food products may increase, shifting the demand curve to the right.
Prices of Substitutes:
- If the price of a substitute good rises, the demand for the original good may increase as consumers switch to the cheaper alternative.
- Example: If the price of tea rises, the demand for coffee (a substitute good) may increase, shifting the demand curve for coffee to the right.
Prices of Complements:
- If the price of a complementary good falls, the demand for the original good may increase as they are often consumed together.
- Example: If the price of printers decreases, the demand for ink cartridges may increase, shifting the demand curve for ink cartridges to the right.
Expectations of Future Prices:
- If consumers expect prices to rise in the future, they may decide to purchase more of a good now, increasing demand and shifting the demand curve to the right.
- Example: If there are expectations that the price of petrol will rise in the future, consumers may increase their current demand for petrol.
Population Size/Structure:
- A change in the size or demographic structure of the population can also shift the demand curve. An increase in population generally increases demand for goods and services.
- Example: An ageing population may lead to an increased demand for healthcare services.
The Concept of Diminishing Marginal Utility and How This Influences the Shape of the Demand Curve
Diminishing Marginal Utility
Definition: The law of diminishing marginal utility states that as a person consumes more units of a good or service, the additional satisfaction (utility) gained from each extra unit decreases. In other words, the marginal utility of each additional unit declines as consumption increases.
- Example: The first slice of pizza might provide a high level of satisfaction, but as more slices are consumed, the satisfaction from each additional slice diminishes.
Influence on the Shape of the Demand Curve
The concept of diminishing marginal utility helps explain the downward sloping demand curve. As the price of a good or service decreases, consumers are willing to purchase more of it because the marginal utility they receive from each additional unit justifies the lower price.
Why the Demand Curve Slopes Downwards: As the price of a good decreases, the marginal utility of each additional unit consumed becomes more appealing relative to the price. Consumers are willing to purchase more of the good at a lower price because the additional satisfaction gained from each unit is still positive, but it is less than the previous unit.
- Example: If the price of chocolate bars falls, consumers may buy more because the satisfaction they gain from each additional bar is still positive, even though it's less than the satisfaction from the first one.
Summary of Key Points
| Concept | Explanation | Example |
|---|---|---|
| Movement Along a Demand Curve | Occurs when the price of a good changes, leading to a change in the quantity demanded. | A fall in the price of smartphones leading to an increase in the quantity demanded. |
| Shift of a Demand Curve | Occurs when a non-price factor (e.g., income or tastes) changes, leading to a change in demand at all price levels. | A rise in income increasing demand for luxury goods, shifting the demand curve right. |
| Factors Shifting the Demand Curve | Changes in income, tastes, prices of substitutes or complements, expectations, or population can shift the demand curve. | A rise in the price of coffee leading to a rightward shift in the demand for tea. |
| Diminishing Marginal Utility | The decrease in additional satisfaction gained from consuming each additional unit of a good. | The satisfaction from eating more slices of pizza decreases as more slices are consumed. |
| Impact on the Demand Curve | As price falls, consumers are willing to buy more due to the diminishing marginal utility. | Consumers are willing to buy more chocolate bars as the price decreases, despite diminishing satisfaction from each additional bar. |
Summary
In economics, demand is influenced by both movements along the demand curve and shifts of the curve itself. Movements along the curve occur when price changes, while shifts are caused by non-price factors such as income, tastes, and the prices of related goods. The concept of diminishing marginal utility explains why the demand curve slopes downward, as consumers are willing to purchase more of a good when its price falls, despite the decreasing utility derived from each additional unit consumed. Understanding these principles helps explain consumer behaviour in markets and how changes in external factors affect demand.
Category
