Price Determination
This section explains price determination covering, the equilibrium price and quantity and how they are determined, the use of supply and demand diagrams to depict excess supply and excess demand, the operation of market forces to eliminate excess demand and excess supply and the use of supply and demand diagrams to show how shifts in demand and supply curves cause the equilibrium price and quantity to change in real-world situations.
Equilibrium Price and Quantity and How They Are Determined
Equilibrium in a market occurs when the quantity demanded by consumers is equal to the quantity supplied by producers. At this point, the market is in balance, and there is no pressure for the price to change. The equilibrium price is the price at which the quantity demanded equals the quantity supplied, and the equilibrium quantity is the quantity bought and sold at this price.
How It Is Determined:
- The demand curve shows the relationship between the price of a good and the quantity demanded. As the price decreases, the quantity demanded generally increases, and vice versa.
- The supply curve shows the relationship between the price of a good and the quantity supplied. As the price increases, the quantity supplied generally increases, and vice versa.
- The equilibrium price is determined where the supply and demand curves intersect. This is the price where there is neither excess supply nor excess demand.
- The equilibrium quantity is the quantity of goods or services bought and sold at the equilibrium price.
Example: In the market for apples, the equilibrium price might be £1 per apple, and the equilibrium quantity might be 100,000 apples. This is the price at which consumers are willing to buy 100,000 apples, and producers are willing to supply 100,000 apples.
The Use of Supply and Demand Diagrams to Depict Excess Supply and Excess Demand
Excess Demand (Shortage):
Excess demand occurs when the price is set below the equilibrium price. At this price, the quantity demanded exceeds the quantity supplied, creating a shortage in the market.
Image
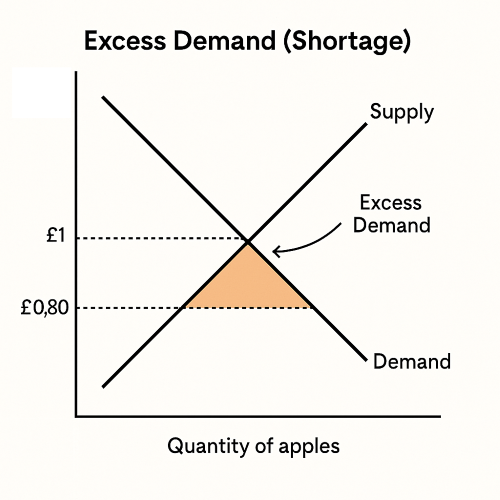
Diagram Explanation: On a supply and demand diagram, if the price is below the equilibrium price, the demand curve will be to the right of the supply curve, showing more demand than supply.
Example: If the price of apples is set at £0.80 (below the equilibrium price of £1), consumers will want to buy more apples than producers are willing to supply, creating a shortage.
Excess Supply (Surplus):
Excess supply occurs when the price is set above the equilibrium price. At this price, the quantity supplied exceeds the quantity demanded, creating a surplus in the market.
Diagram Explanation: On a supply and demand diagram, if the price is above the equilibrium price, the supply curve will be to the right of the demand curve, showing more supply than demand.
Example: If the price of apples is set at £1.20 (above the equilibrium price of £1), producers will be willing to supply more apples than consumers are willing to buy, creating a surplus.
The Operation of Market Forces to Eliminate Excess Demand and Excess Supply
Excess Demand (Shortage):
- When there is excess demand, consumers are willing to buy more of a good than producers are willing to sell at the current price. This creates upward pressure on the price. As the price rises, the quantity demanded decreases (because of the law of demand) and the quantity supplied increases (because of the law of supply) until the market reaches equilibrium.
Example: If the price of apples is £0.80, creating excess demand, producers will see the shortage and may decide to raise the price. As the price increases, demand will decrease, and supply will increase until the market reaches the equilibrium price of £1.
Excess Supply (Surplus):
- When there is excess supply, producers are willing to supply more than consumers are willing to buy at the current price. This creates downward pressure on the price. As the price falls, the quantity demanded increases, and the quantity supplied decreases until the market reaches equilibrium.
Example: If the price of apples is £1.20, creating excess supply, producers will lower the price to sell off the excess stock. As the price decreases, demand will increase, and supply will decrease until the market reaches the equilibrium price of £1.
The Use of Supply and Demand Diagrams to Show How Shifts in Demand and Supply Curves Cause the Equilibrium Price and Quantity to Change in Real-World Situations
Shifts in the Demand Curve:
- A shift in the demand curve occurs when there is a change in a non-price factor that affects demand (e.g., income, tastes and preferences, price of substitutes or complements).
- Rightward Shift (Increase in Demand): If demand increases (e.g., due to higher consumer income), the demand curve shifts to the right. This leads to a higher equilibrium price and quantity.
Example: If a new study shows that eating apples improves health, demand for apples will increase, shifting the demand curve to the right. As a result, the equilibrium price and quantity of apples will rise.
- Leftward Shift (Decrease in Demand): If demand decreases (e.g., due to a decrease in consumer income), the demand curve shifts to the left. This leads to a lower equilibrium price and quantity.
Example: If a health scare makes consumers avoid apples, demand for apples will decrease, shifting the demand curve to the left. As a result, the equilibrium price and quantity of apples will fall.
Shifts in the Supply Curve:
- A shift in the supply curve occurs when there is a change in a non-price factor that affects supply (e.g., production costs, technological advances, government policy).
- Rightward Shift (Increase in Supply): If supply increases (e.g., due to improved production technology), the supply curve shifts to the right. This leads to a lower equilibrium price and a higher equilibrium quantity.
Example: If a new technology allows farmers to grow apples more efficiently, the supply of apples will increase, shifting the supply curve to the right. As a result, the equilibrium price will fall, and the equilibrium quantity will rise.
- Leftward Shift (Decrease in Supply): If supply decreases (e.g., due to an increase in production costs), the supply curve shifts to the left. This leads to a higher equilibrium price and a lower equilibrium quantity.
Example: If the cost of fertiliser increases, the supply of apples will decrease, shifting the supply curve to the left. As a result, the equilibrium price will rise, and the equilibrium quantity will fall.
Summary of Key Points
| Factor | Effect on Supply/Demand Curve | Effect on Equilibrium Price | Effect on Equilibrium Quantity |
|---|---|---|---|
| Increase in Demand | Demand curve shifts right | Price rises | Quantity rises |
| Decrease in Demand | Demand curve shifts left | Price falls | Quantity falls |
| Increase in Supply | Supply curve shifts right | Price falls | Quantity rises |
| Decrease in Supply | Supply curve shifts left | Price rises | Quantity falls |
Summary
The determination of price and quantity in a market relies on the interaction of demand and supply. The equilibrium price is where the quantity demanded equals the quantity supplied, and market forces naturally work to eliminate excess demand or supply. Shifts in demand or supply curves, due to factors like changes in consumer preferences, income, production technology, or government policies, lead to changes in the equilibrium price and quantity. Understanding these shifts is essential for analysing real-world market behaviour and forecasting the effects of various economic events.
Category
