Equilibrium Levels of Real National Output
This section explains equilibrium levels of real national output covering, the concept of equilibrium real national output and the use of AD/AS diagrams to show how shifts in AD or AS cause changes in the equilibrium price level and real national output.
Introduction to Equilibrium Levels of Real National Output
In economics, the equilibrium level of national output refers to the level of real GDP where the total demand for goods and services in the economy (aggregate demand, AD) equals the total supply of goods and services (aggregate supply, AS). At this point, the economy is in a state of balance, with no pressure for national output or the price level to change.
This concept is important because it helps explain the current level of economic activity, the price level, and how various economic factors influence national income.
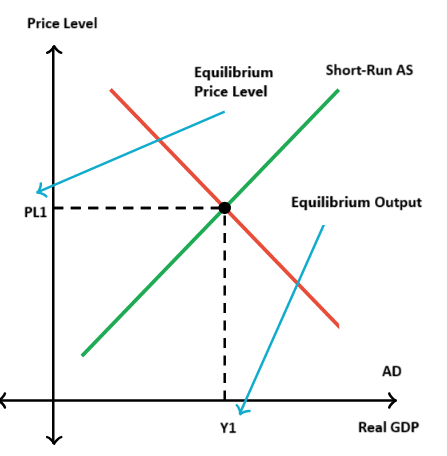
The Concept of Equilibrium Real National Output
In an economy, equilibrium occurs when aggregate demand (AD) equals aggregate supply (AS) at a particular level of real national output (real GDP). This is the point where the amount of goods and services produced in the economy (real output) matches the amount that consumers, businesses, the government, and foreign buyers are willing to purchase at that price level.
- Aggregate Demand (AD) is the total demand for goods and services in an economy, and it is composed of consumption (C), investment (I), government spending (G), and net exports (exports minus imports).
- Aggregate Supply (AS) refers to the total quantity of goods and services that producers in an economy are willing and able to supply at different price levels, given the level of national output.
The equilibrium level of real national output is determined by where the AD curve intersects the AS curve. At this point, there is no pressure to increase or decrease output, and the price level is stable.
Image
- If AD = AS, the economy is in long-run equilibrium at the equilibrium level of national output.
- If AD > AS, the economy is operating above equilibrium, leading to inflationary pressure (an increase in the price level).
- If AD < AS, the economy is operating below equilibrium, leading to deflationary pressure (a decrease in the price level).
The Use of AD/AS Diagrams to Show How Shifts in AD or AS Cause Changes in the Equilibrium Price Level and Real National Output
The AD/AS model is a graphical representation of the relationship between the price level and the total output (real GDP) of the economy. This model helps explain how shifts in aggregate demand or aggregate supply can lead to changes in the equilibrium level of real national output and the price level.
The Aggregate Demand (AD) Curve
The AD curve shows the total quantity of goods and services demanded at each price level in the economy. It is typically downward-sloping, indicating that as the price level falls, the quantity of goods and services demanded increases (and vice versa). This inverse relationship occurs for the following reasons:
- The Wealth Effect: As the price level falls, the real value of money increases, leading to higher consumer spending.
- The Interest Rate Effect: A fall in the price level leads to lower interest rates, encouraging more investment and consumption.
- The Exchange Rate Effect: A lower domestic price level makes a country’s goods and services cheaper for foreign buyers, increasing exports.
The Aggregate Supply (AS) Curve
The AS curve shows the total quantity of goods and services that producers in the economy are willing to supply at each price level. There are two main types of aggregate supply curves:
- Short-Run Aggregate Supply (SRAS): In the short run, the AS curve is upward-sloping. As the price level increases, businesses are willing to supply more goods and services because they expect higher profits.
- Long-Run Aggregate Supply (LRAS): In the long run, the AS curve is vertical at the potential or natural level of output (Yₙ), which is determined by factors such as the economy's stock of capital, labour, and technology. Changes in the price level do not affect the level of real national output in the long run, only in the short run.
Shifts in the Aggregate Demand (AD) Curve
When there is a shift in the AD curve, it reflects a change in the total demand for goods and services in the economy. The AD curve can shift due to factors such as:
- Changes in consumer confidence: If consumers expect the economy to do well, they may spend more, shifting the AD curve to the right.
- Changes in investment: If businesses increase investment, it will shift the AD curve to the right.
- Changes in government policy: For example, a government increase in spending or a reduction in taxes can shift the AD curve to the right.
- Changes in net exports: An increase in demand for a country’s exports (e.g., due to a fall in exchange rates) can shift the AD curve to the right.
Impact of a Rightward Shift in AD: When AD increases (AD shifts right), the equilibrium level of output rises, but this also causes an increase in the price level, leading to demand-pull inflation.
Impact of a Leftward Shift in AD: When AD decreases (AD shifts left), the equilibrium level of output falls, and the price level may decrease, leading to a recessionary gap (deflationary pressure) where output is below potential output.
Shifts in the Aggregate Supply (AS) Curve
The SRAS curve can shift due to changes in factors that affect the cost of production, such as:
- Changes in wages: An increase in wages increases production costs, causing the SRAS curve to shift left (decrease in output).
- Changes in the price of raw materials: If the price of raw materials increases, the cost of production rises, shifting the SRAS curve left.
- Changes in productivity: Improvements in productivity can reduce costs and shift the SRAS curve to the right.
The LRAS curve can shift due to changes in factors like:
- Technological advancements: Increased technology or innovation can increase the productive capacity of the economy, shifting the LRAS curve to the right.
- Increases in labour force: A larger or more skilled workforce increases potential output, shifting the LRAS curve to the right.
- Increases in capital stock: More investment in capital goods increases the productive capacity of the economy, shifting the LRAS curve to the right.
Impact of a Rightward Shift in AS: When the SRAS or LRAS curve shifts right, the economy's productive capacity increases, leading to an increase in national output and a potential decrease in the price level, assuming AD remains constant.
Impact of a Leftward Shift in AS: When the SRAS curve shifts left, it indicates higher costs of production, leading to a decrease in real output and an increase in the price level (cost-push inflation). A leftward shift in the LRAS curve indicates a reduction in the economy's potential output.
Equilibrium and Changes in the Price Level and Output
- Initial Equilibrium: The initial equilibrium occurs where the AD curve intersects the AS curve at a particular price level and output.
- Shifting AD to the right: A rightward shift in AD increases output and raises the price level, moving the economy towards a higher equilibrium.
- Shifting AS to the right: A rightward shift in AS increases output and lowers the price level, reducing inflationary pressure.
In both cases, the equilibrium level of national output changes, but the impact on the price level will depend on which curve (AD or AS) shifts and by how much.
Summary
- The equilibrium level of real national output is where aggregate demand (AD) equals aggregate supply (AS). At this point, the economy is in balance, with no pressure for change in national output or the price level.
- AD/AS diagrams are used to analyse how shifts in AD or AS influence the equilibrium price level and national output. A shift in AD affects the price level and output, while a shift in AS affects output and, depending on the direction, may influence the price level.
- Understanding the effects of shifts in AD and AS is crucial for analysing economic performance and the impact of government policies.
Key Takeaways
- The AD/AS model helps us understand how the economy reaches equilibrium and how various factors influence national income and price levels.
- Shifts in the AD curve can cause changes in both output and price level, while shifts in the AS curve affect output and may lead to changes in the price level, depending on the direction of the shift.
- This model is essential for understanding the dynamics of the economy, especially in relation to policies aimed at stabilising or stimulating economic growth.
This guide will assist in your understanding of equilibrium and the use of AD/AS diagrams for analysing changes in the economy.
Category